As a key person in the Project Team, interfered with Stakeholders, Digital Marketing Team and Web Analytics Specialists to detail requirements.
Collaborate with Digital Marketing Team to understand the end-to-end customer journey and applying design changes according to best user experience.
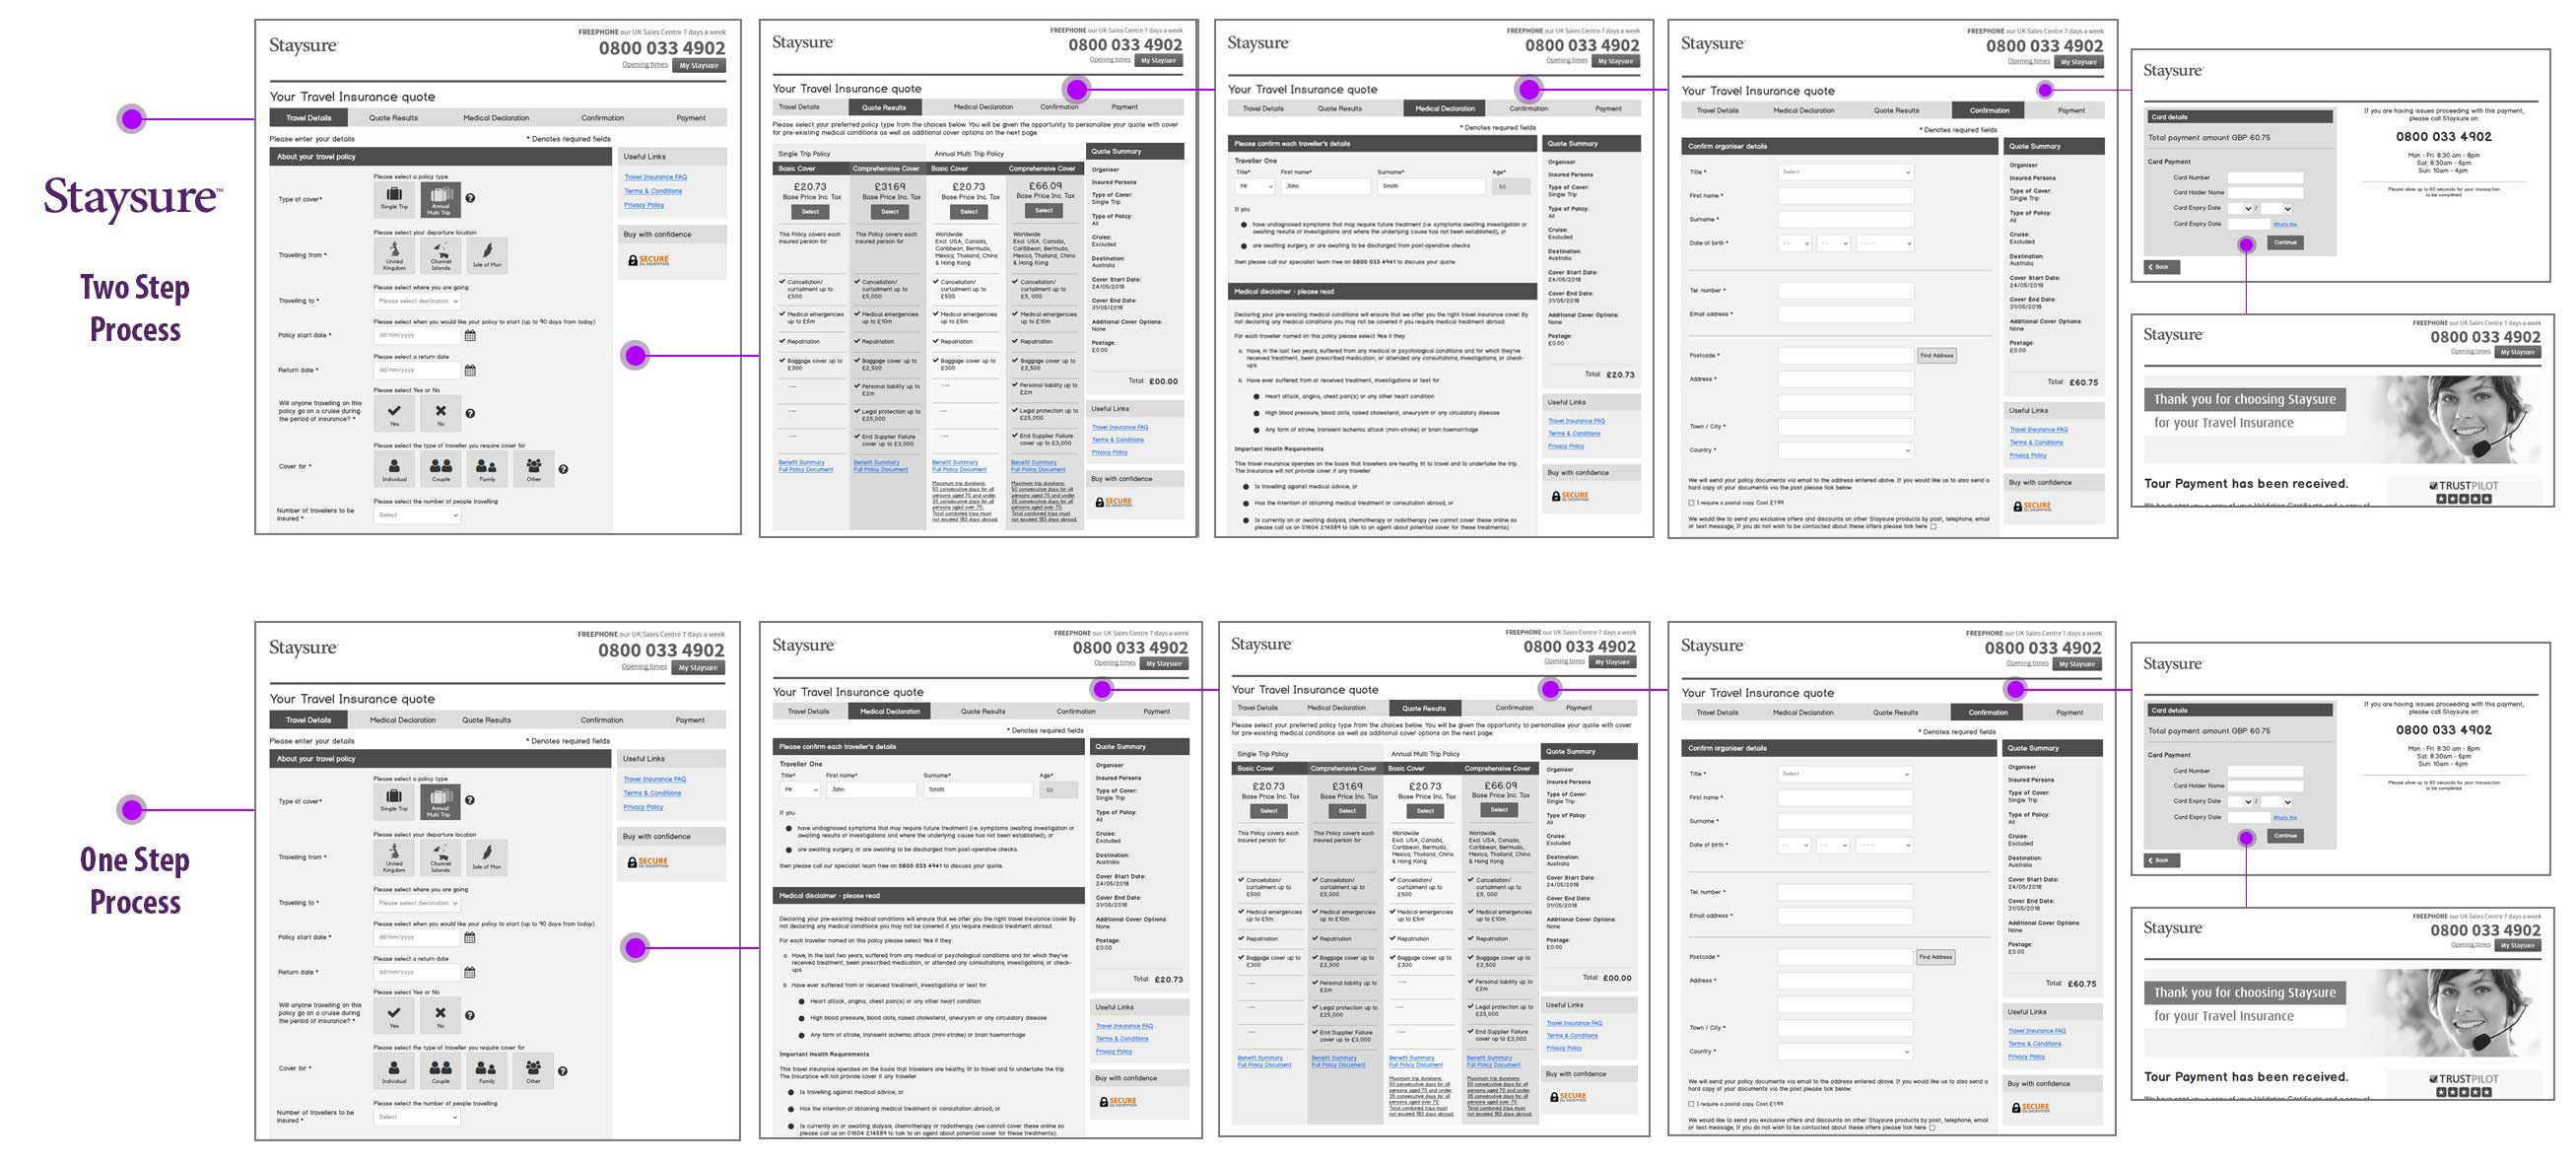
Implementing user centered design changes, create wire-frames, mock-ups using Balsamiq, user flows for Website Optimization
Conducting A/B Testing identifications according to on-line conversion rate improvements.
Led interactive design for mobile and tablet apps, and complex large-scale websites in both waterfall and agile delivery environments.
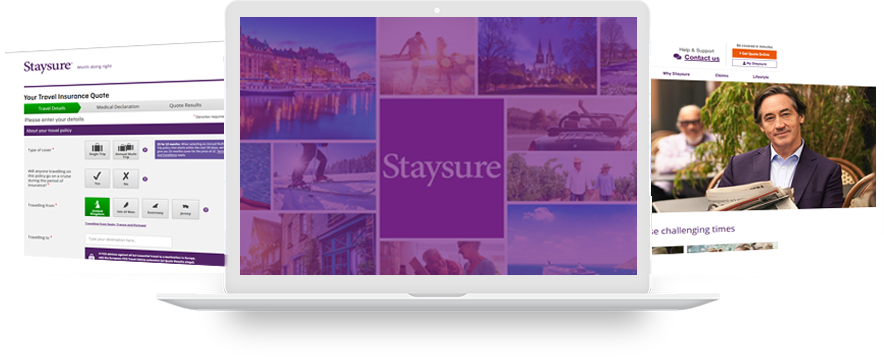
This case study explores the process of redesigning the Quote process enhance user experiences.
Our challenge was to enhance the quote process with processing the medical declaration in early stage and giving the excat insurance quote to the clients.
As this project was a group effort, we focused to redefine the user journey and developed user centric solutions that would help users and the business accomplish their goals.
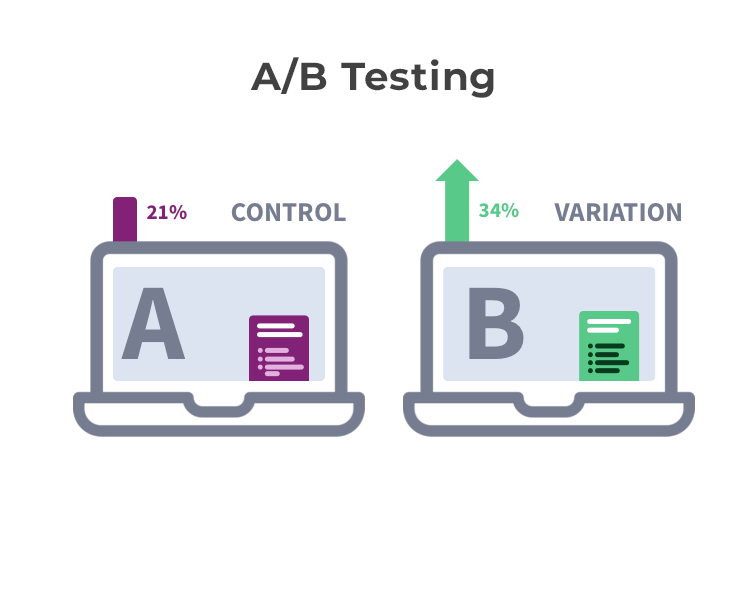
A/B testing allows to make careful changes to their user experiences while collecting data on the results. This allows them to construct hypotheses, and to learn better why certain elements of their experiences impact user behavior. In another way, they can be proven wrong—their opinion about the best experience for a given goal can be proven wrong through an A/B test.
It involves in real time user traffic so no assumptions.
Specially B2B technology company may want to improve their sales lead quality and volume from campaign landing pages. In order to achieve that goal, the team would try A/B testing changes to the headline, visual imagery, form fields, call to action, and overall layout of the page.
Testing one change at a time helps them pinpoint which changes had an effect on their visitors’ behavior, and which ones did not. Over time, they can combine the effect of multiple winning changes from experiments to demonstrate the measurable improvement of the new experience over the old one.
In here analytics will often provide insight into where we can begin optimizing. It helps to begin with high traffic areas of staysure quote process get quote section, as that will allow you to gather data faster. Look for pages with low conversion rates or high drop-off rates that can be improved through this.
Your conversion goals are the metrics that you are using to determine whether or not the variation is more successful than the original version. In here the goal is clicking the Get Quote button to complete the quote process and purchase the travel insurance.
After identifying the goal we genarated the A/B testing ideas and hypotheses for why we think it will be better than the current version. We name existing version as Two Step Process and the new version One Step Process
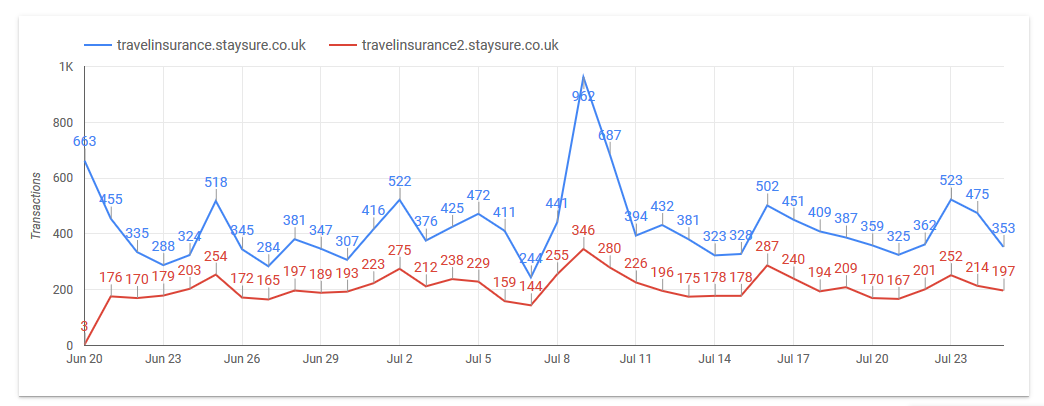
In here we have use Optimization Tool and Google Analytics tool to do A/B testing. When user hit the Get Quote button then it ramdomly 50% of traffic goes to www.travelinsurance.staysure.co.uk (One-Step process) and 50% goes to www.travelinsurance2.staysure.co.uk (Two-Steps process)
Kick off the experiment and wait for visitors to participate. At this point, we monitored the real time user traffic it will be randomly assigned to either the control or variation of your experience. Their interaction with each experience is measured, counted, and compared to determine how each performs using google analytics
After the experiment completed, it's time to analyze the results. Using google analytics data we can see the difference between how the two versions of the page performed, and whether there is a statistically significant difference the conversion rate.